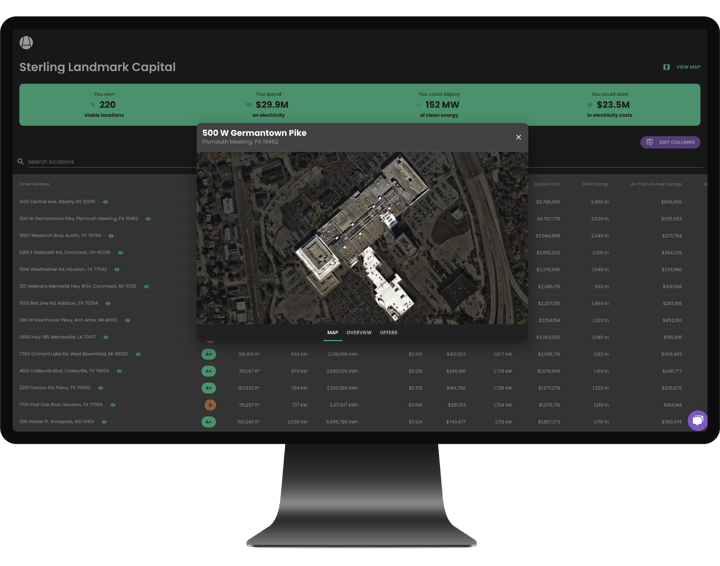
What sets our analytics capabilities apart from others is our ability to provide an indicative evaluation of the clean energy potential of a building without requiring detailed information about it. All we need is the building’s address.
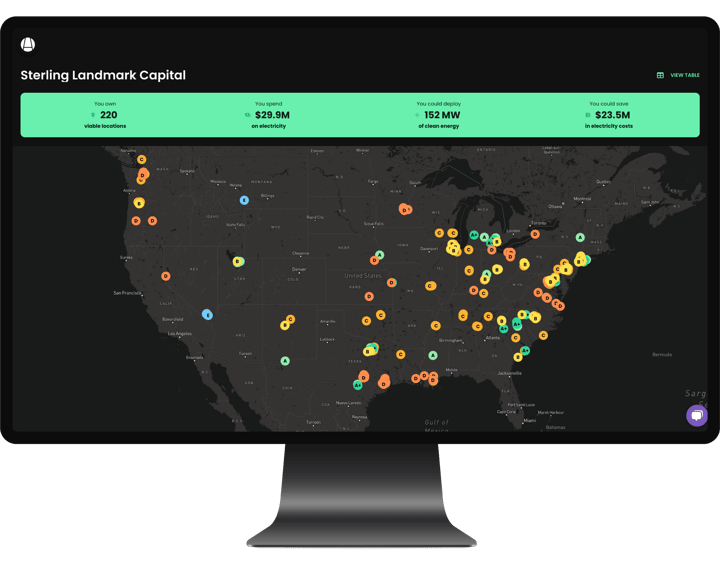
Being able to provide a quick first assessment of building portfolios that might be as large as thousands of buildings, without requiring any legwork from the real estate owner or tenant, significantly lowers the barrier to deploying clean energy assets on more locations faster— A win/win for everyone.
⚙️ How We Assess A Building
1. Determining the Status Quo
To generate an indicative estimate of the building’s energy profile using just its address, we infer a lot of information about the building. As one progresses through the evaluation process, we can iteratively replace information that we infer with any concrete data provided. For example, when given annual energy usage or cost information, it replaces our own inferred value for a more precise evaluation and recalculates the assessment instantly.
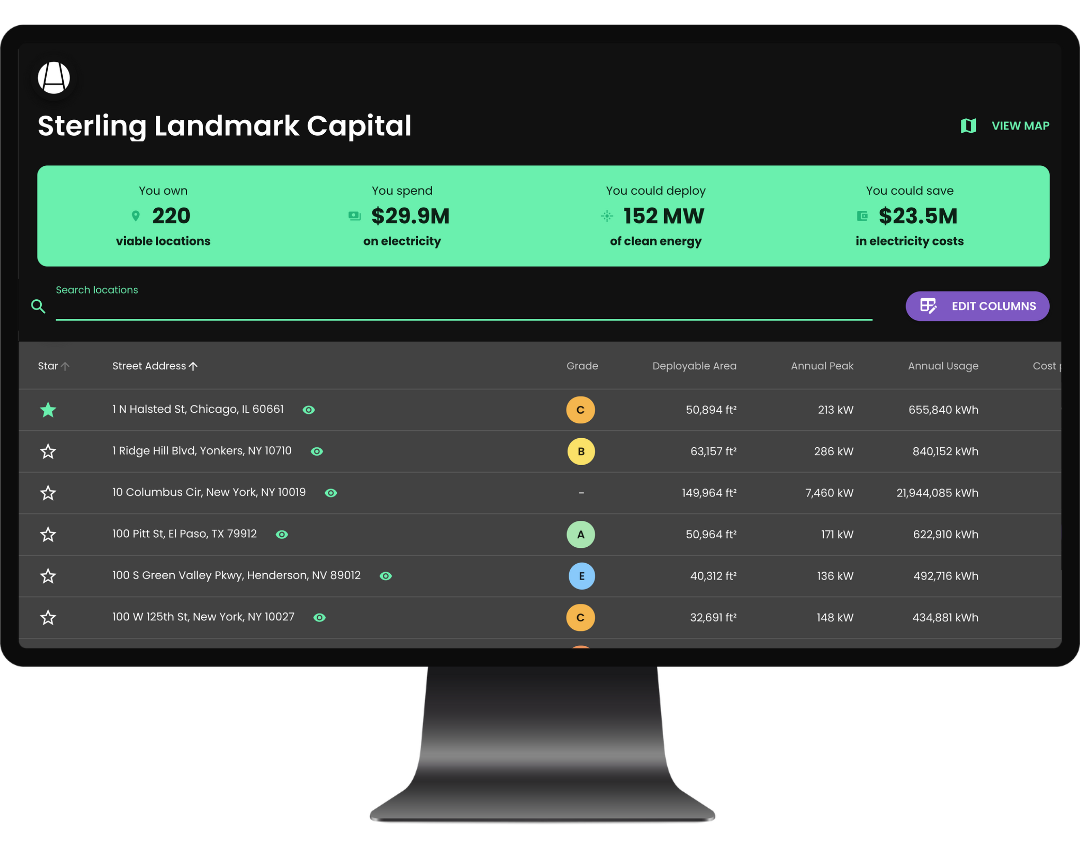
Station A has built an analytics infrastructure that allows us to infer a lot of information about a building when just given an address. We can determine the approximate shape of the building, the building's occupants and the type of business they are conducting within it using publicly available data, commercial sources of data and data models built in-house. Creating this building profile allows us to infer the characteristics of the electrical load of a location.
Combining this with other location-dependent data, such as the utilities that serve the region and the available tariffs, allows us to get a glimpse of the financial picture as far as the occupants' electricity bills are concerned.
2. Recommending Clean Energy Solutions
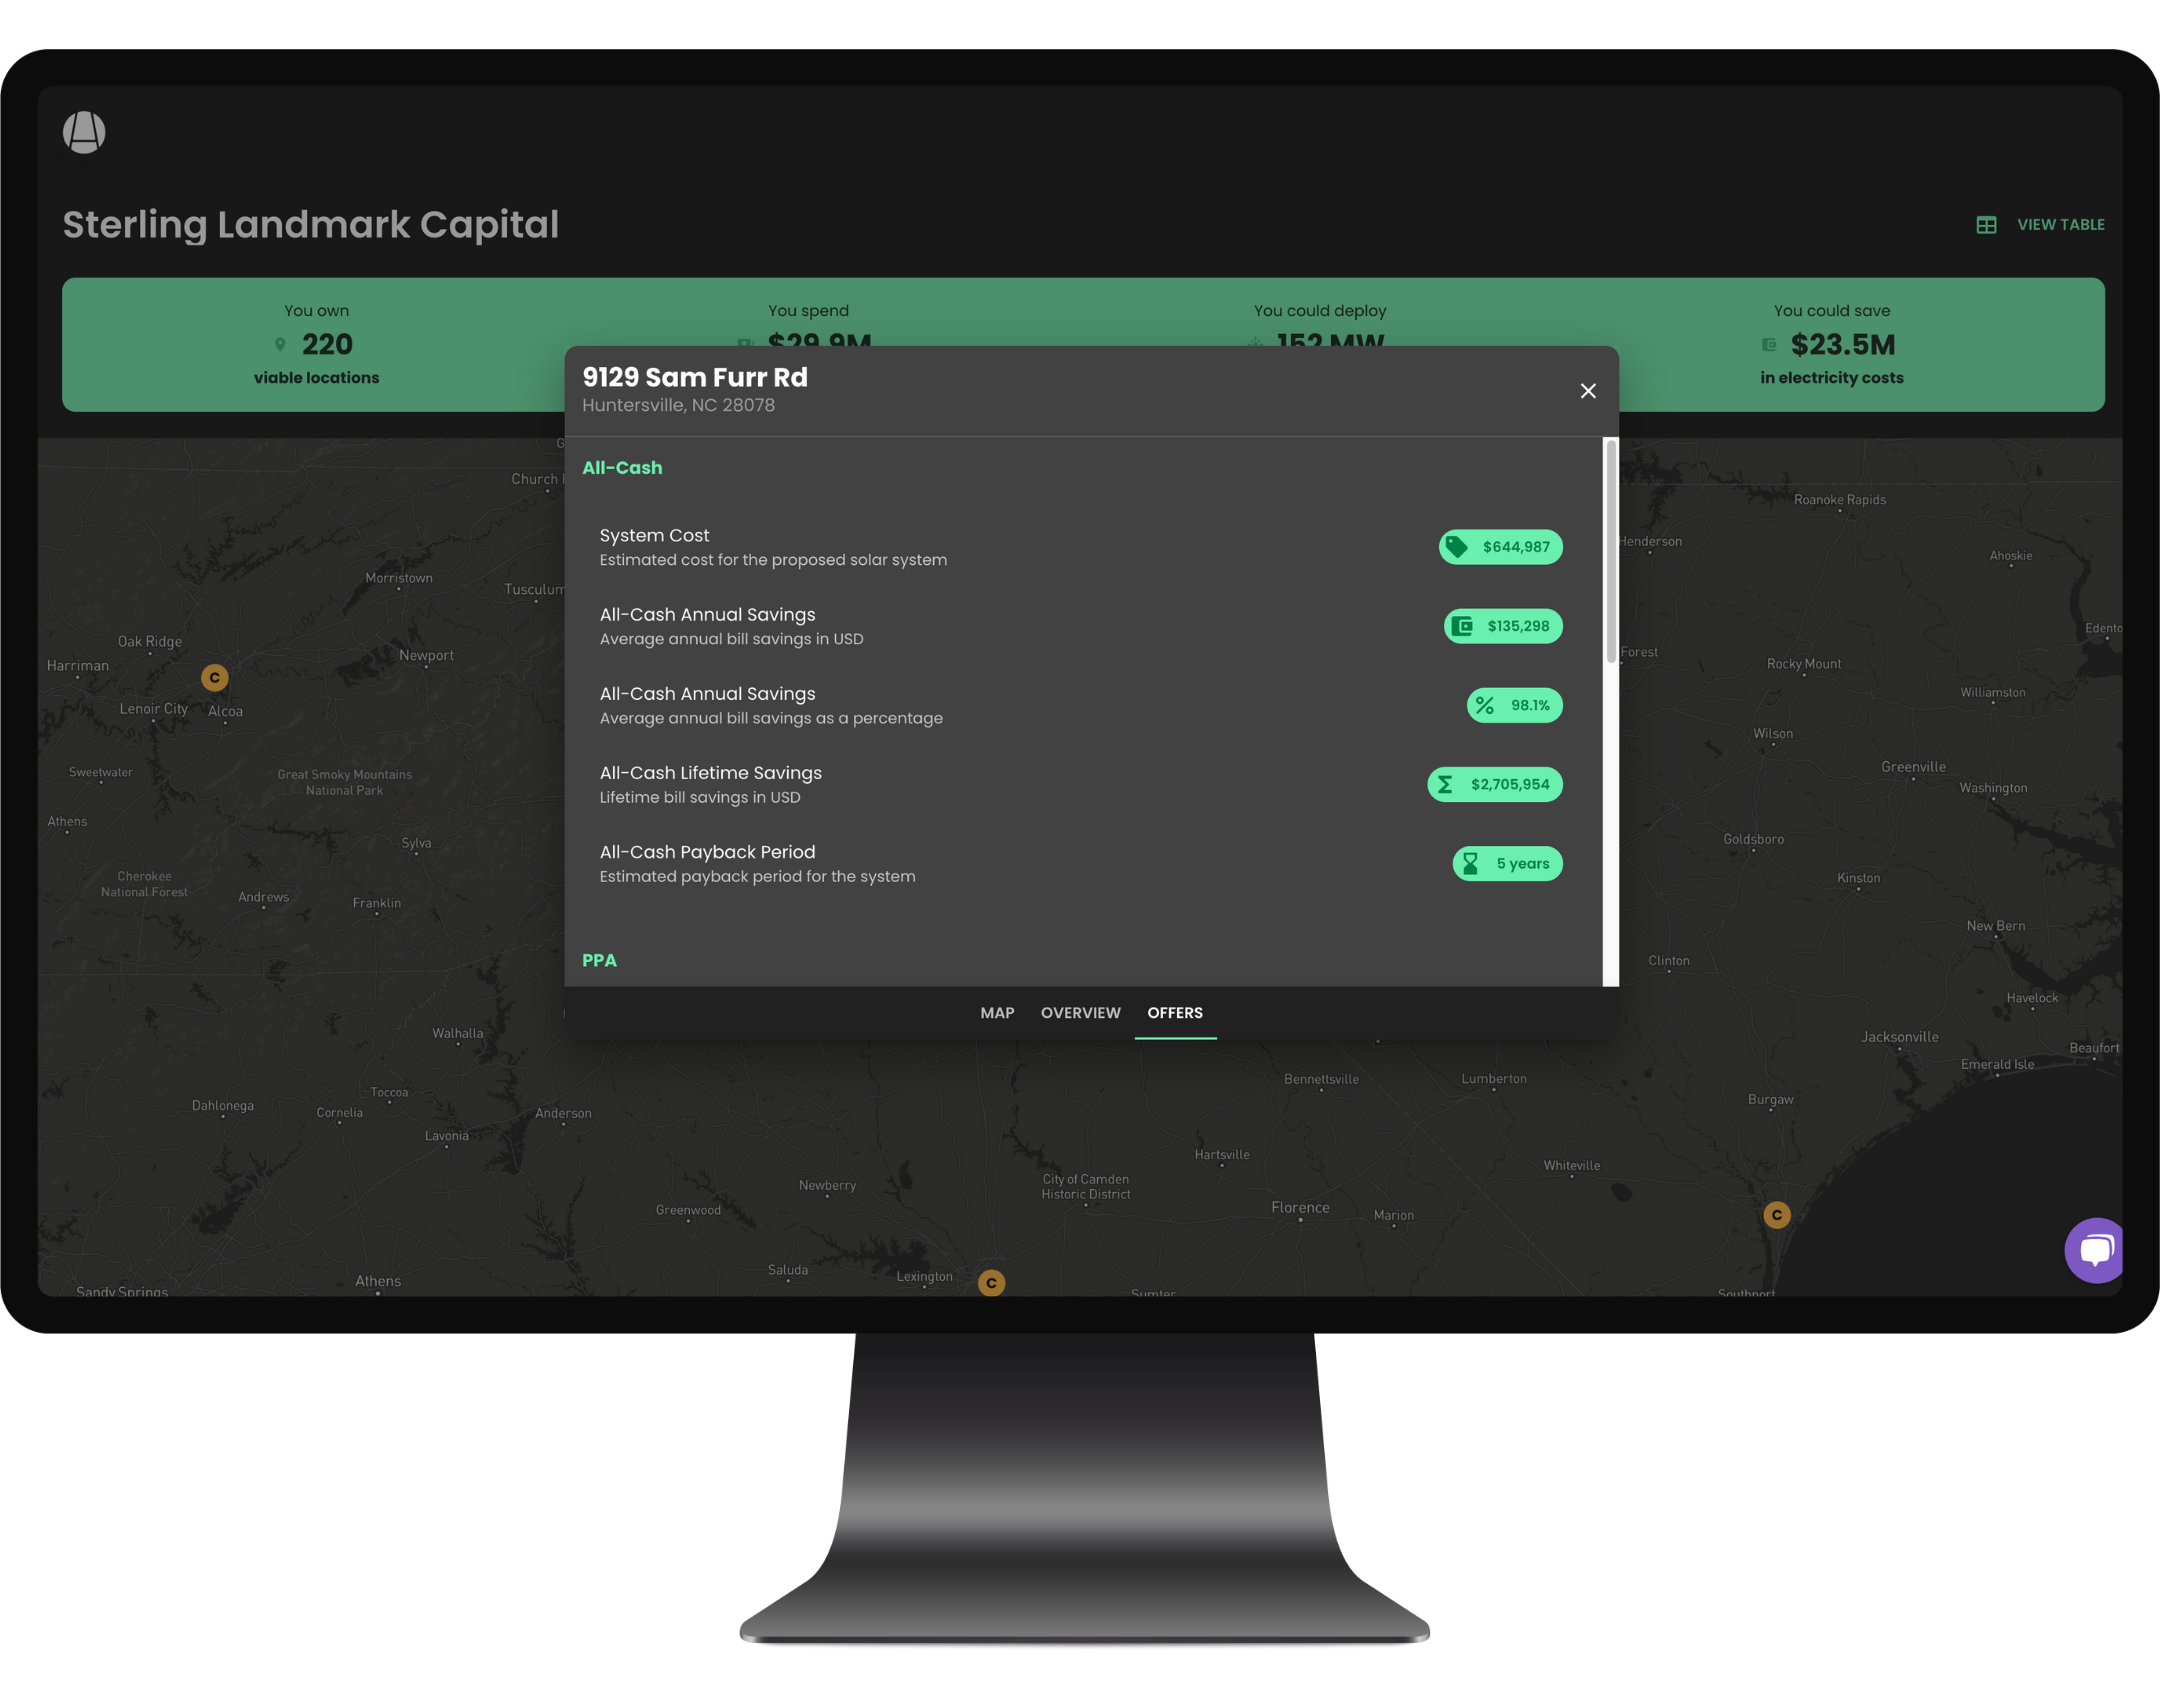
Once we’ve determined the status quo, we determine what type of clean energy solutions can be utilized at a given location. Different constraints limit the type and the "how much" of a solution that can be deployed. For example:
- Technical Constraints: Rooftop solar is only applicable on suitable roofs, and the amount of rooftop solar is limited by the amount of unobstructed roof space that is available to install solar panels on. This is an example of a technical constraint that our automated evaluation accounts for.
- Regulatory Constraints: Community solar might be a good option, but at present, community solar is only available in a handful of states. This is an example of a regulatory constraint that our automated evaluation accounts for.
- Financial Constraints: Some locations might have plenty of space on-site, either on the rooftop or on a parking lot, to deploy large amounts of solar generation. However, the actual system that gets built might be smaller because it doesn’t make economic sense to size a system to produce more electricity than the building consumes over the course of a year. This is an example of a financial constraint that our automated evaluation accounts for.
🚥 Station A Grades 1.0
When we first introduced grades at Station A, we gave greater value to locations that provided a lot of different financially-viable ways to deploy or finance clean energy assets. This led us to develop heuristics that blended numerous metrics together, such as:
- The availability and financial feasibility of onsite solar financed via PPA.
- Large financial savings potential when purchasing a system outright.
- Additional financial benefits, such as the eligibility for renewable energy credits (RECs).
⏰ Times Are A-Changin'
The financial and, to some extent, the regulatory world has changed quite significantly since the beginning of 2022:
- Rising interest rates have an effect on the cost of capital, changing the dynamics of PPA or lease-financed systems.
- The passing of the IRA, which allows for the transfer of the 30% federal tax credit to third parties, as well as the ability to secure extra bonus credits, has made all-cash purchases viable for more parties.
- The change from net-metering to net-billing (NEM 3.0) in California, one of the largest markets for clean energy assets in the United States, has decreased the incentive to build larger than-needed onsite systems.
- Supply chains that are still experiencing some strain have put the brakes on ever-declining build costs.
We've also learned a lot about our customers’ needs and wants since we first introduced grades:
- PPA and third-party financed systems are a smaller portion of the projects coming through our marketplace than we initially anticipated.
- Grades based on heuristics that are a blend of multiple options muddle the waters for customers: This doesn’t aid the transparency our process strives to create. Clean Energy buyers want (and need) to be in the know and understand our evaluation process. Needlessly complicated grades are needlessly hard to explain and understand.
- Station A grades used to tend towards recommending larger systems due to the economy of scale and the sheer absolute amount of savings they might bring. However, in the wake of policy changes such as the introduction of NEM 3.0 in California, smaller systems can sometimes yield better economics by optimizing the ratio between electricity that is self-consumed vs. exported to the grid.
🚀 Station A Grades 2.0
These considerations prompted us to revisit the way Station A grades are computed. The changes in the economic landscape and the fact that most of our customers choose to self-finance caused us to switch to a simpler grading system that is easy to explain yet still correlates well with metrics that our customers typically care about.
Station A Grades 2.0 classify locations based on the Payback Period or the amount of time that it will take an onsite solar installation at that location re-coop its initial cost in the form of bill savings and other credits, such as RECs.
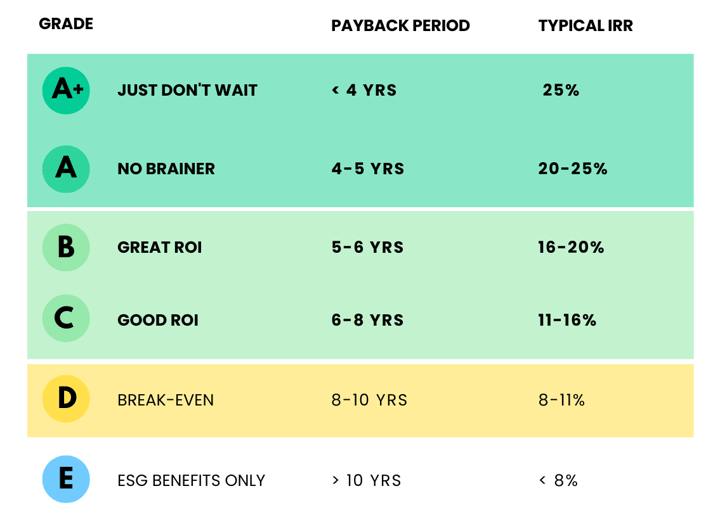
The payback period is a key metric that many of our customers were already prioritizing, and it made sense to calibrate our grades to it. Another metric that we find to be used quite often is the Internal Rate of Return (IRR). It turns out that these two metrics are closely correlated, so looking at grades based on the payback period is a very good approximation for project IRR as well.
%20(1).gif?width=525&height=394&name=graph-savings-12%20(1)%20(1).gif)
The graph above models Bill Savings % YOY from an all-cash financed array as you increase the % of usage offset and is an example of the research done to model supply and demand with the new NEM 3.0 compensation structure in California to better estimate how to size an onsite solar project for optimal financial return.
.png?width=526&height=401&name=Untitled%20(3).png)
Station A grades based on the project payback period align well with Internal Rate of Return (IRR): The width of each blob at a given IRR value is proportional to the number of projects with that particular IRR. The black bar within each blob shows its "center": The IRR range into which 50% of all projects fall. The white dot within that black bar indicates the median IRR value. While there is some overlap in the vertical (IRR) outer regions of each blob, the overlap is fairly small and the IRR ranges of the "center" bars are clearly separated.
Despite the fact that Station A grades 2.0 no longer include PPA metrics, our grades are still very useful if you are considering PPA financing. We have found that in today's market, having good all-cash economics is a better indicator for being able to secure a good PPA rate rather than the output from predictive models based on market data from even just a year ago.
🔮 What's Next?
In the future, we want our grading system to be responsive to the changes in the market, from interest rates to build costs, so we anticipate revisiting this view every year and making adjustments to stay in line with how buyers see the opportunities around them. If you have any feedback on our grades and methodology please feel free to let us know at grades@stationa.com.
If you've obtained a Station A grade for a single building either by looking it up on our map, or by requesting a grade, or by working with our team to have your entire real estate portfolio evaluated, now is a good time to circle back to take a look at your updated grade(s). With our new grading scale, any building graded “D” or higher ‘pencils’ or will pay back for itself over the lifetime of the project. Login to your Station A account to view an existing evaluation.
👋 Station A can help
Station A’s goal is to make onsite clean energy evaluation and deployment a reliable and seamless experience for any project type.
If you represent a corporation that wants to learn more about Station A please reach out to us at info@stationa.com. Try out our free portfolio evaluation tool by uploading your list of addresses or grade a single building at stationa.com.