With this release, we're taking a big step forward in delivering on our goal to provide unprecedented ease in evaluating a building’s clean energy potential, giving businesses more confidence in establishing their clean energy priorities and the tools needed to decarbonize faster.
We took the same quality analysis we’ve delivered via static PDF and turned it into a dynamic, interactive and editable view of your portfolio’s onsite clean energy potential. Requiring only a building’s address as an input, Station A Portfolios provides a new level of access and data transparency to clean energy analysis.
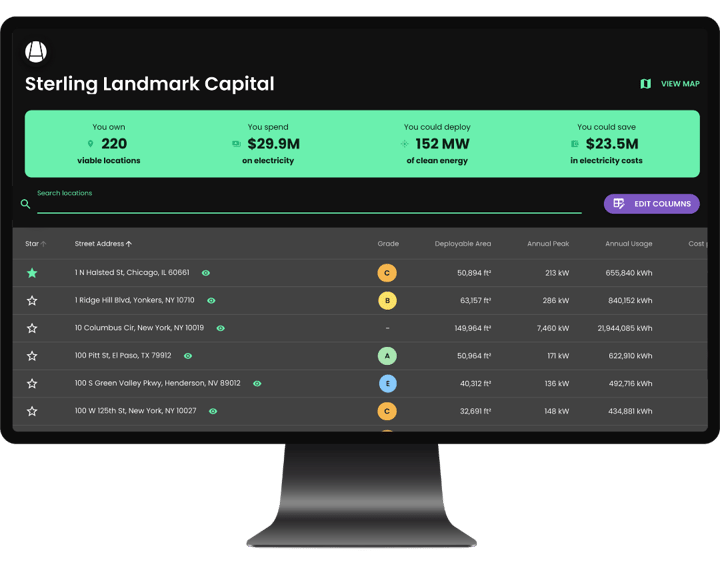

👀 A quick look
🔓 How to access it
All that’s needed to start building your Portfolio is a .xlsx or .csv list of building addresses, evaluation of your first 50 addresses for free.
- Request your Portfolio evaluation via the request form at stationa.com.
- Upload your list of addresses.
- Station A will respond via email with an invite link to your custom Portfolio.
✨ Highlights
- View portfolio data in one place: Starting with just a list of addresses you can build an online clean energy profile that adapts to you and the market.
- Use grades as your guide: Our grades predict the likelihood that a clean energy investment will pay back financially to help you prioritize your best sites faster.
- Dive into all the data: See the figures used to evaluate your site from the cost of electricity, installation area, annual consumption and more.
- Update assumptions: Work with our team to edit our input assumptions with your actuals and we’ll do the re-computing in seconds.
- Get automatic updates forever: From policies to incentives to build costs and PPA rates, as the market changes, Station A will refresh your estimates.
🧱 How we built it
Maintaining and keeping up-to-date an authoritative view of all commercial buildings is no small task. This effort is powered by almost a decade of investment in collecting, understanding, transforming and communicating data on the ever-changing built environment and calibrated with the past two years of actuals from our marketplace. We are confident that this personalized view is an essential tool for any large or small portfolio owner.
🔮What’s next
Our industry-leading predictions are just the starting point — but you know your buildings better than we do.
In the future, we will be adding more ways for you to improve and augment the underlying data used in the modeling, from the cost of electricity to roof age and tenant lease term so that you can prioritize based on how you see the world.
The world changes quickly and we want your view of your portfolio’s clean energy potential to change with it. From incorporating California’s NEM 3.0 change to the impact inflation has on both build costs and PPA rates, we will be incorporating significant new policies and market conditions automagically so you can focus on other things.
👋 Station A needs you
We're building this tool for you, so please let us know how we can improve it to meet your biggest challenges. We know how challenging decarbonization can be, our goal is to make it feel easy.