👀 Segment Anything
A couple of weeks ago, Meta AI published a paper and web demo for a model they’ve built called “Segment Anything” (aka SAM), which performs various forms of image segmentation. Image segmentation is the process by which different parts of an image (aka segments) can be automatically picked out from a given image 🤯.
An example of SAM performing automatic image segmentation on a photo of my two favorite critters in the whole world.
This same model is capable of performing interactive image segmentation, which is similar to image segmentation, but has the added capability to pick out a more specific part of the image based on interactive input, e.g. hovering or clicking on a specific part of the image.
An example of SAM performing interactive image segmentation on a photo of a cute pupper. Note how different segments are highlighted as the mouse cursor moves over them.
An example of SAM performing interactive image segmentation on a photo of three furballs. Note how multiple clicks are used to extract multiple segments.
Notably, their paper also indicates that SAM is based on a relatively recent idea in the AI space called vision transformers (ViT), which are a special application of transformers applied to computer vision tasks such as image classification, segmentation, etc. Transformers, in this case, is referring to the same underlying mechanism that enables other recent models (e.g. ChatGPT, where “T” = “transformer”) to scale in size and continue to outperform other currently-known architectures.
☀️ From pet photos to solar analyses
While using AI to pick out our favorite pets from photographs was exciting in and of itself, reading Meta's research sparked a business use case we had to explore.
At Station A we help solve a wide variety of problems that make building clean energy slow, inefficient, and risky. One of those key problems is the evaluation of a building's clean energy potential. This process typically requires lots of manual data collection and an expert to digest and analyze that data. Station A Portfolios automates this data collection and analysis using only an address as an input.
Now of course, there are a gajillion (yes, we’ve counted them) different data points needed in order to make a decision about which clean energy solutions to consider for a location. But among those many data points are the ones relating to the physical context of a location, i.e. physical attributes of a location make it a good or bad fit for different clean energy solutions. Below is a grossly simplified diagram describing some of the obvious ones:
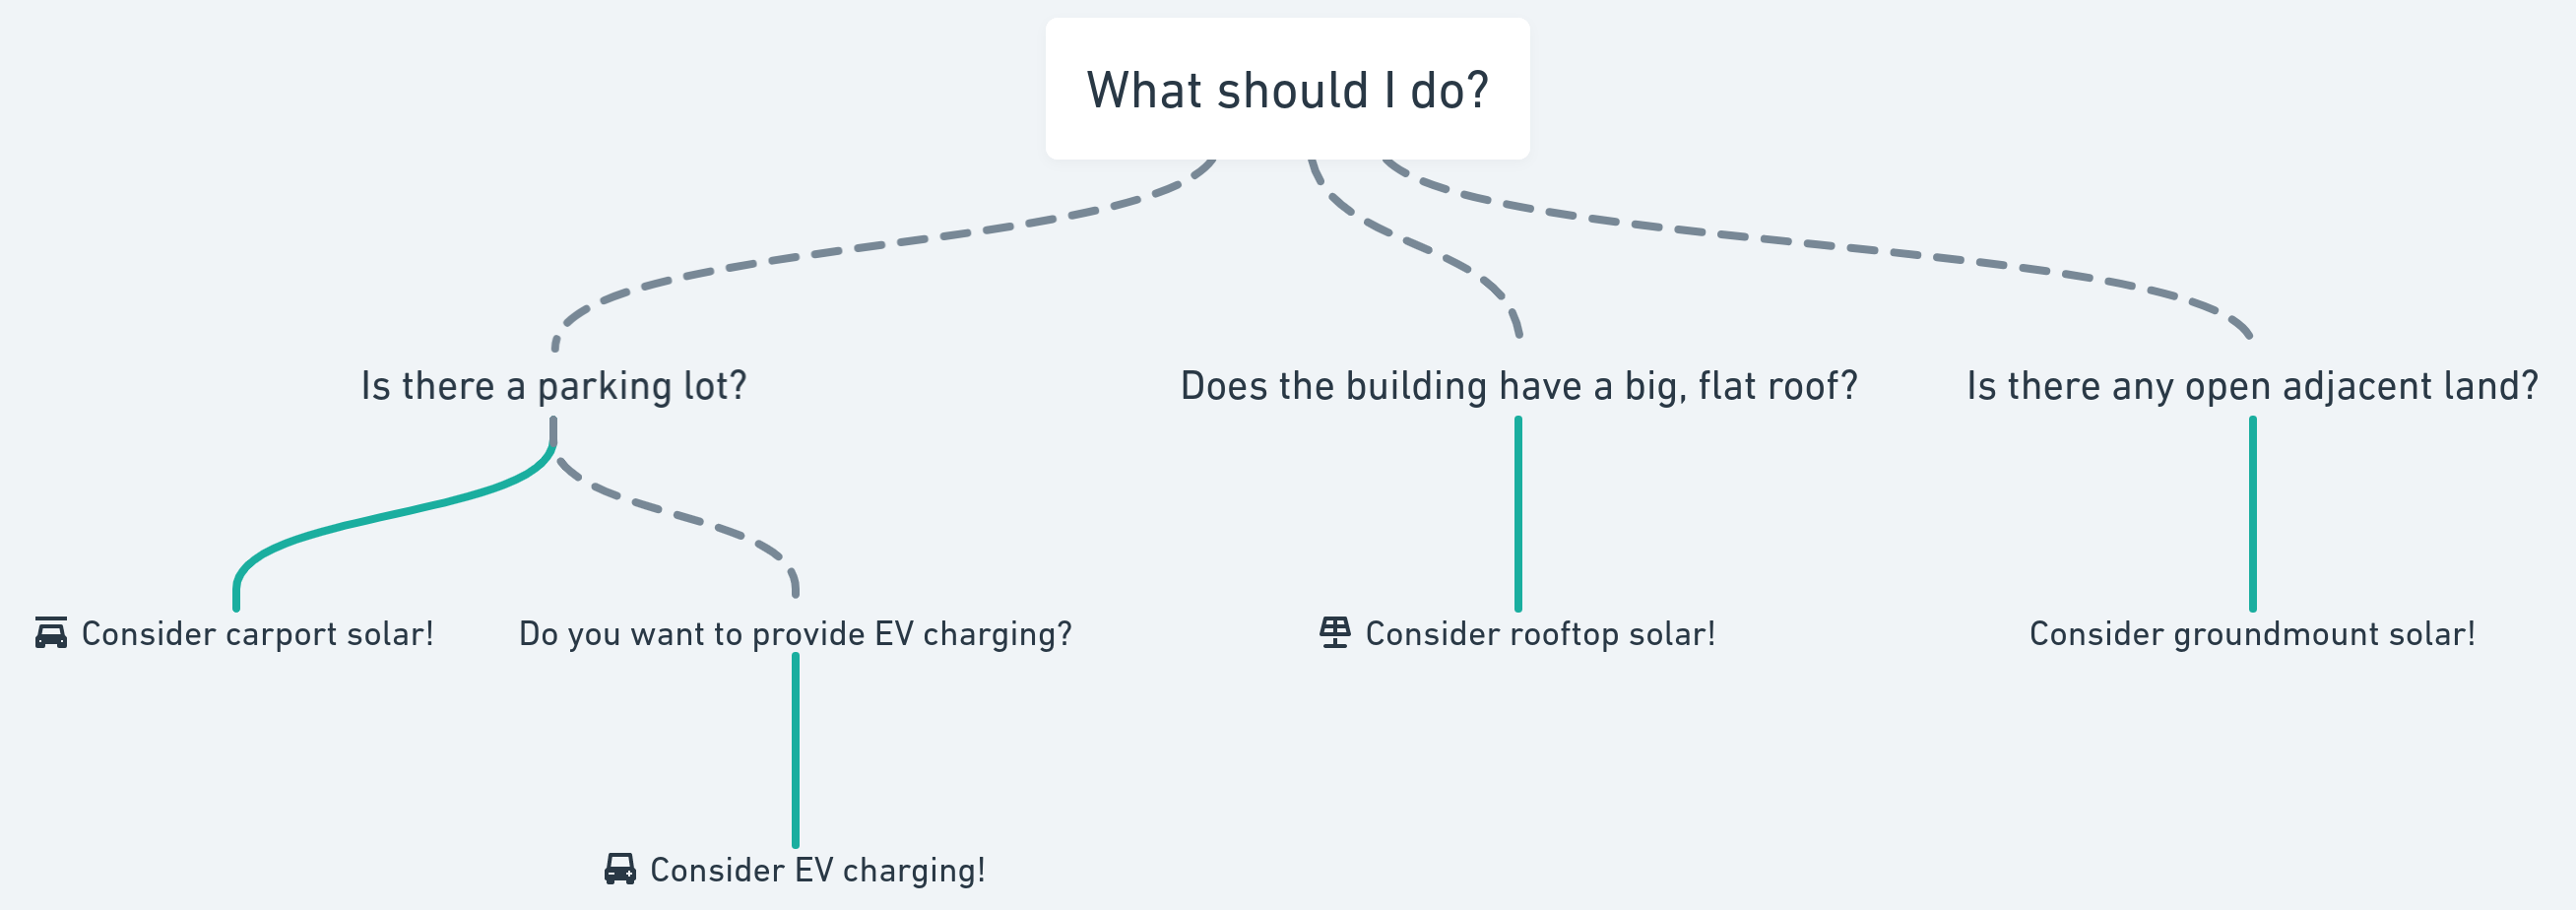
These questions are simple enough to manually answer for a handful of locations—we could look at a location on Google Maps and easily see if there is a parking lot. Today, our portfolio analysis more or less does just that: it automatically estimates the physical context for a location based on the data we maintain on the built environment. But, there is inevitably a small portion of locations where we don’t have existing data. For these locations, we use an in-house tracing tool we built to enable the team to fill in some of the physical context data gaps.
A quick demonstration of how we use our internal tooling, aptly named “Trace”, to help fill in data gaps related to a building by tracing the outline in satellite imagery.
While this tooling makes things easy enough to fill in a few gaps, how would we scale this to say, 100, 1,000, 100,000 buildings? And what about being able to answer some of the questions that don’t involve a building, e.g. is there a parking lot? If so, how big is it?
👋 Attention is all you need
Synthesizing together the research done by Meta and the gaps we have in our evaluation technology, we began experimenting with how to leverage SAM to help us interactively pick out a building from a satellite image.
A demonstration of SAM used to interactively segment the white building in a satellite image.
Impressive! Without any further fine-tuned training of SAM, what used to take a few pixel-perfect clicks to trace the corners of this building now just needs a singular, loosely-positioned click!
However, while for the most part, a single click seems to be sufficient in picking out the right parts of the imagery, we found that in some cases it took more than one click for the model to get it right, particularly in cases where the satellite image is pretty bad.
For some satellite images (especially low-resolution or noisy ones), SAM needs several clicks to be provided in order to pick out the right segment.
This presented a clear challenge for us, since unfortunately if you aren’t paying millions of dollars for defense-grade imagery, chances are your satellite images are generally pretty bad.
✏️ Scribble Anything
In digging deeper into Meta’s research, there was one thing that caught my eye: a graph that benchmarked the relative performance (in mIoU) vs. number of mouse clicks of SAM vs. other interactive segmentation models, including current state-of-the-art models such as RITM.
.png?width=461&height=293&name=Untitled%20(1).png) A graph showing how SAM’s performance compares to other interactive segmentation models, including current state-of-the-art models such as RITM.
A graph showing how SAM’s performance compares to other interactive segmentation models, including current state-of-the-art models such as RITM.
There are a couple of interesting takeaways from these benchmarks:
- SAM achieves markedly higher single-click performance over other models
- In all cases, as the number of clicks increases, the model performance also increases with diminishing returns
Armed with this knowledge, we considered how we could support a user experience that encourages more than one click, without requiring the user to spend extra time perfecting additional clicks.
What we ended up with was a creative solution to the problem: instead of prompting the user for a number of clicks, instead allow the user to draw or “scribble” a line over the image, from which the model can sample as many or few “clicks” as it needs.
A demonstration of an early prototype of our “Scribble Anything” tool showing a quick “scribble” capturing a building’s rooftop shape, where SAM would normally require several clicks.
By sampling multiple input points from a quickly user-drawn “scribble”, we achieve a reasonable balance between maintaining SAM’s performance and limiting the time it takes a user to trace a shape. This ultimately translates to improving our product’s ability to answer more questions about a location, faster.
An early prototype of our “Scribble Anything” tool shows a few different kinds of physical shapes it can auto-trace:
An early prototype of our “Scribble Anything” tool shows how easily it can capture complex building shapes:
An early prototype of our “Scribble Anything” tool showing how fluid, continuous “scribbles” can capture even the most complicated shapes.
🔮 What’s next?
While there are a few items left to iron out (e.g. denoising, mask polygonization, etc.), we plan to begin implementing this novel technology directly into our internal data labeling tools as soon as possible to start reaping the benefits from this assistive AI. But we have broader ambitions for where we take this capability even further. Below are just a handful of the ideas we’re hoping to experiment with and explore further:
- Improved SAM performance may be possible by using AI super-resolution/denoising to upscale poor imagery.
- Tile server integration for SAM’s ViT embeddings could provide a more interactive map experience for generating arbitrary raster labels.
- Fully automated tracing might be possible by taking SAM’s non-interactive segmentation outputs and feeding each segment into an image classifier trained on labels generated by our internal tooling.