


☀️ California continues to lead the way on renewables
California’s NEM 3.0 policy signaled a seismic shift in how exported electricity from renewable systems gets compensated after April 2023. The policy itself was tuned to optimize the grid ecosystem as a whole, a necessary step in the evolution of this market. What you'll learn below is that CPUC, the regulatory body in charge of this change, seems to have threaded the needle and was able to maintain viability for new solar in the vast majority of sites. The no-brainer "A+'s" are no longer available but solid financial returns remain for most sites.
📈 Station A's data-driven insights at scale
Station A indexes every single commercial building in the US and evaluates the financial viability of the site for solar using both publicly available and our best guess of assumptions for each site. Using the power of this dataset, we can at scale investigate the impact on individual project economics for onsite solar using the 130,000 commercial buildings in California that Station A has indexed and continues to evaluate.
🙃 The impact of NEM 3.0
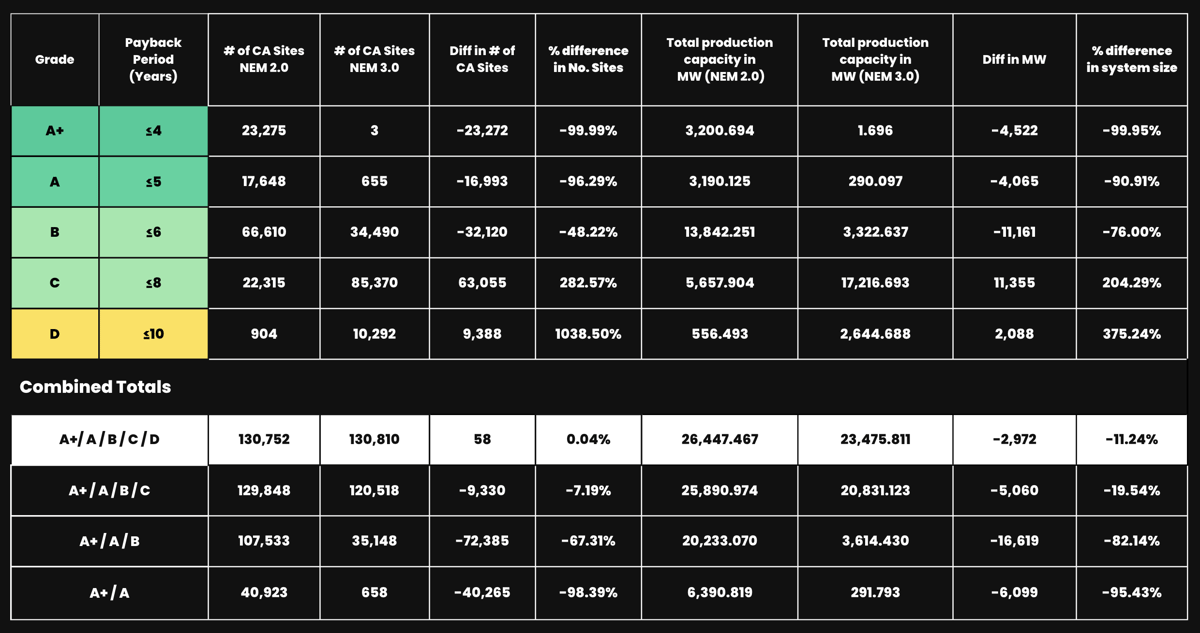
This comparison of Station A’s clean energy grades dataset pre and post-California’s new NEM 3.0 policy shows that while the financial incentives for an onsite solar project have been reduced, the number of financially viable projects (projects that stand to generate a positive ROI in their lifetime) is nearly unchanged.
The impacts of NEM 3.0 are most staggering when you look at the impact on the financial incentive of rooftop solar projects in California on what were the most financially attractive sites under NEM 2.0. We estimate that "A+" projects can expect a payback period of under 4 years and an IRR of greater than or equal to 20%. The "A+" group saw a 95.43% drop in MW capacity under NEM 3.0 and the number of "A+" buildings dropped from ~23K to just 3.
The impact of NEM 3.0 on the financial viability of projects is much less dire. Using our grading scale, buildings with a grade of "D" or better are estimated to pay back in 10 years or less and correlate to an Internal Rate of Return (IRR) of ≥8%, an industry standard for the minimum acceptable rate of return for a capital expenditure project. This group saw an +58 increase in the number of buildings that could host a financially viable solar project, a 0.04% increase. While a reduction in the financial benefit of deploying a rooftop solar project will inevitably have a cooling effect on the market especially for financed projects with higher interest rates, we still see a strong financial case for rooftop solar projects in California.
Like the broader market, we do expect interest rates to cool in 2024 so even those without cash to invest may have opportunities to save in the near-future.
Now more than ever, it seems like a no-brainer to competitively bid out your projects, especially in California.
👋 Station A can help
If you want to see how NEM 3.0 changes your de-carbonization plan for an individual building, you can search for it and claim it here. If you want to see how it impacts your entire portfolio, follow this link.